 I’m often asked a series of questions related to managing team health, creating realistic schedules, the need for crunch time, how to “squeeze an extra 20%” out of an already efficient team, and so on.
Here I explain what we did at Zynga with anonymous surveys, to objectively assess team health and make improvements.
This topic is especially on my mind as friends and colleagues discuss recent suggestions that working in the gaming industry is just supposed to be insane.
Café World
When I started at Zynga in 2010, I joined the team running the game Café World.
Café World had an incredibly bright and hard working set of folks who were struggling to get releases out on time and hit business targets. Things got much better over time, though it took some focused effort.
My General Manager (GM) wrote a report each week, summarizing the state of the game from a business perspective. Part of that report featured a green / yellow / red team health assessment, with a short explanation of the reason for the status.
So once a week the GM would ask me how the team was doing, and I would respond with something like
I think green – bunch of folks took last week off for Christmas and are feeling pretty happy right now
or on another week
Flaming red, we had outages twice in the middle of the night last week, half the team was pulled into it and a couple of guys are ready to quit because they’ve haven’t slept since last Tuesday
Yellow, and more Yellow
In spite of my feedback, the team health in the weekly reports almost always trended to yellow. This happened on other teams, too. When I inquired about this, I heard something like this
If I mark the team health RED, I get feedback that I’m pushing the team too hard and burning them out. If I mark the team GREEN, I get criticized for not pushing them hard enough. So I usually just mark it YELLOW.
I called BS on this and suggested that we start an anonymous team health survey, and mark the team health objectively based on the survey data.
Thus was born the weekly health survey.
One Minute Weekly Health Survey
The weekly health survey was created with the following goals
- Lightweight (to encourage participation – less than 1 minute to complete)
- Objective measure (anonymous collection)
- Regular cadence for prompt follow-up (weekly collection)
- Responses support grouping into green / yellow / red categories
- Only measure vital signs – are we burning people out? (Not a comprehensive satisfaction survey, keep it simple)
To this end, the survey featured 4 simple questions focused on
- Hours Worked (objective measure of time in office)
- Tiredness (self-reported state of mind, independent of hours worked)
- Efficiency (perceived effectiveness, is process working or causing frustration?)
- Comments (optional section for free-format feedback)
The survey also requested that the individual identify their current team and (optionally) their current role (engineer, product manager, artist, …).
Objective Results
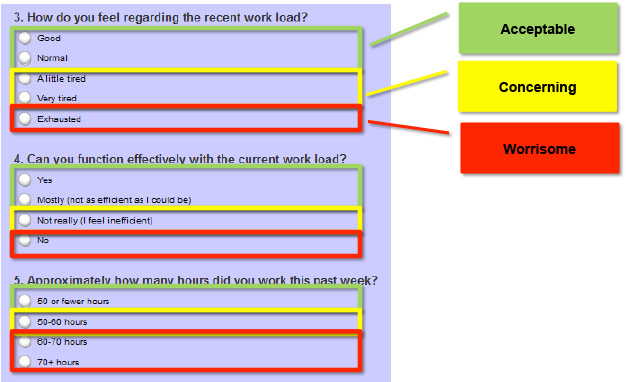
This image shows how the survey questions might be partitioned into green / yellow / red categories.
This part is, of course, subjective, but once decided upon leads to consistent evaluations and apples-to-apples comparisons between teams.
Running The Surveys
Although the surveys originated on the Café World team, they rolled out over time to include many other teams, eventually covering the majority of teams at Zynga.
We collected data for each team, as well as the company as a whole (an aggregate average), and sent summary results back to business leaders for their team, as well as the company averages.
Result Of Surveys
What results did we see from running the surveys?
The immediate result of the surveys was that we could spot obvious hot spots (directly from the multiple choice questions, or indirectly from the free-format comments). This created an opportunity for prompt follow up and corrective action with the affected teams.
However in a broader sense two trends were observed over time
- Reduction in variation between teams
- Improvement in average scores overall
In rolling the survey out to multiple teams, it became easier to spot obvious outliers. No business leader wanted to be the one killing their team with overwork. On the other hand, no one wanted to be the one whose team was working less than everyone else, either.
As a result, the first trend was a reduction in variation between teams.
Once the results became more uniformly consistent, a second trend emerged – the average results improved, in general.
The second trend it is less obviously a result of the surveys, but it was pleasing to see nonetheless.
