 I’ve been working at Zynga since early 2010.
One of the challenges of running an online game (like Café World, on which I’ve spent most of my time) involves releasing new features on a regular, predictable cadence.
As a result, our team has devoted resources to collecting metrics on feature development and release timing. We use that data as a feedback mechanism to adjust our scoping and scheduling guidelines.
The approach outlined below describes a process for constructing schedules with relatively high confidence. It also gives a statistical foundation for justifying “padding” which might otherwise raise the eyebrows of skeptical managers.
Driving to Work
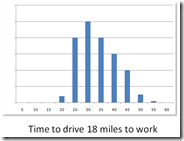 To the left is a histogram of the time required to drive 18 miles to work, over many dozens of trips. The data is not perfect, but roughly models a route that I drove frequently – a mix of highway and local roads.
Most days, the trip took about the same amount of time, around 30 minutes.
An occasional traffic accident would hold things up, maybe requiring 45 minutes. Sometimes bad weather would slow things down; an accident and bad weather together would be even worse – requiring perhaps an hour.
Rarely, with unusually clear traffic and cooperative traffic lights, I could race home in only 20 minutes. But never faster.
Schedules Are Subjective
If you asked me “Steve, how long does it take you to drive to work?” I could sensibly answer
“About 25-35 minutes”
reflecting the average, and most common trip times. And about half the time, I’d be right.
 However if I had a 9am meeting with the CEO, you could be certain that I would leave at 8am or earlier, in order to have a nearly 100% chance of being there on time.
If you wanted to pin me down to something certain, my answer would be something closer to
“An hour or less”
When the stakes are high, a schedule with 50% confidence just doesn’t cut it.
Variability In Driving
Relative to software development, driving to work is a technically non-complicated task (apologies to all you professional drivers out there).
Driving to work is easily understood, and easily repeatable. In my example, the route is executed each time by the same person, in the same way. Only the environmental conditions vary, yet they substantially impact the actual execution.
In spite of the many constants, we observe a remarkable 3:1 variation in performance (20 to 60 minutes).
That is fairly surprising for this non-complicated task.
Tossing Coins
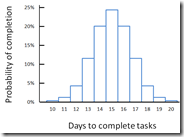 Imagine you are constructing a schedule comprised of 10 tasks which must be executed in sequence. Each has an independent 50% chance of requiring 1 day to execute, and a 50% chance to require 2 days to execute.
Clearly the project will require 10 to 20 days to complete, but what would be a safe estimate? Would the midpoint of 15 days be a reasonable schedule commitment?
 This admittedly simplistic example can be modeled as a series of coin tosses, with a probability distribution as shown in the figures above and to the right.
Because the distribution is symmetric, there is only a 50-50 chance that the tasks will be completed in 15 or fewer days.
Scheduling for 15 days is not a winning strategy for a high-confidence commitment.
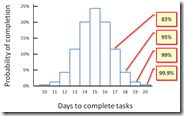
In the figure to the above right, the same distribution is shown with the rightmost bins annotated with the likelihood that the completion time will be fewer than the indicated number of days.
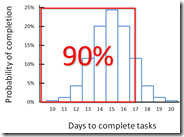 We can use this information to construct a schedule with relatively high confidence.
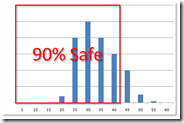
The figure to the right shows a bounding box around 90% of the schedule possibilities.
A schedule estimate between 17 and 18 days will be too short only 1 in 10 times.
Statistical Variation is the Norm
Even if our estimates are perfect (and they are not), environmental factors intrude. The network or VPN can be down, source code control can be broken, or the build might not work. A colleague may have gifted you with an unusually complicated branch merge.
These things happen all the time, yet we often pretend they do not. Software estimation, even when done well, is a highly stochastic process.
Scoping for 90%
I encourage our teams to scope and schedule for a 90% on time rate, since the consequences of schedule misses are fairly severe.
When iterating over a large number of feature iterations of similar size and complexity, it is possible to accumulate statistical evidence to help drive this process in a compelling manner.
For tasks which are highly novel, unusually complicated, or having strong external dependencies, variances are naturally much higher and statistical categorization can remain elusive.
But it’s always worth tracking the original estimates, the actual execution, and their historical variations.

Pingback: Technical Pecha Kucha | Steve Klinkner's blog
Pingback: Thrashing The Delivery Truck | Steve Klinkner's blog